
Study design at a glance
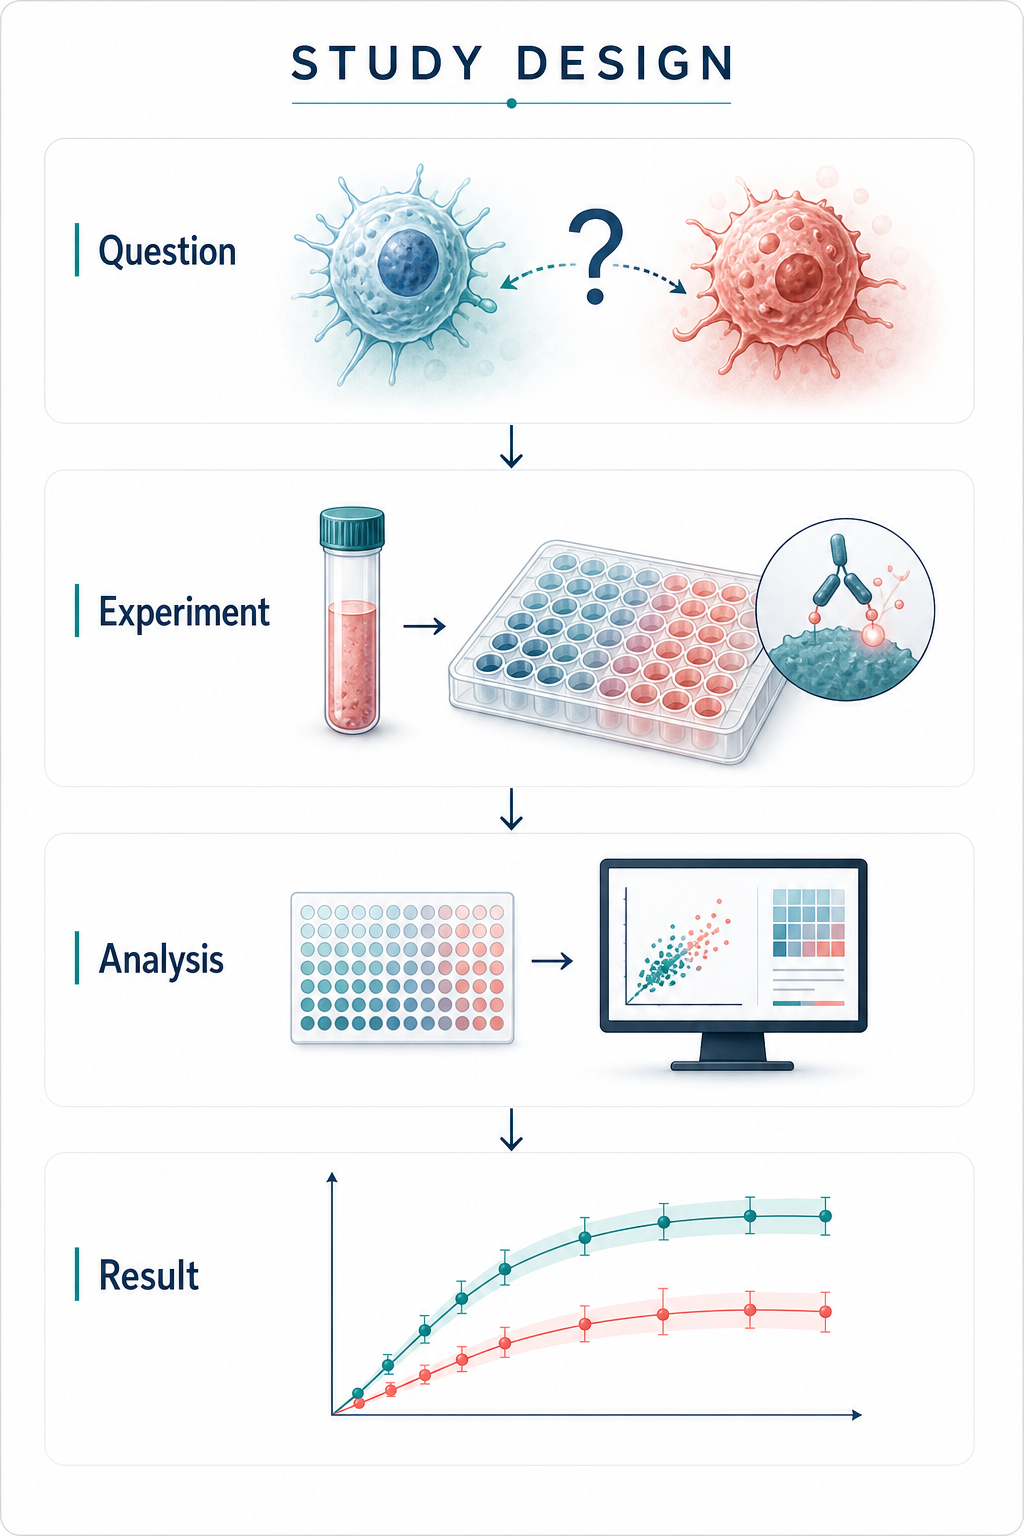
Use a clear sequence to frame the question, experimental context, analysis, and qualified result.
Visual direction
For scientific talks, posters, and journal clubs
Plan an AI-assisted figure for a conference talk, grand rounds, or journal club around the research question, evidence, and review process—not a generic image type.
Study design
A concise path from question to visual result.
Move from a focused brief to a reviewable visual with a simple, repeatable process.
Write the question, audience, setting, and one intended takeaway before selecting panels, icons, or visual style.
Distinguish source-backed data, conceptual mechanisms, methods, and future work so a draft never presents an assumption as a result.
Use panel order, labels, scale, and contrast to make the essential relationship legible at the intended viewing distance.
Check data, statistics, terminology, disclosures, permissions, and organization-specific requirements before presenting or publishing.
Write the question, audience, setting, and one intended takeaway before selecting panels, icons, or visual style.
Distinguish source-backed data, conceptual mechanisms, methods, and future work so a draft never presents an assumption as a result.
Use panel order, labels, scale, and contrast to make the essential relationship legible at the intended viewing distance.
Check data, statistics, terminology, disclosures, permissions, and organization-specific requirements before presenting or publishing.
Organize the question, evidence, mechanism, and takeaway before detailed figure production so collaborators can review the structure early.
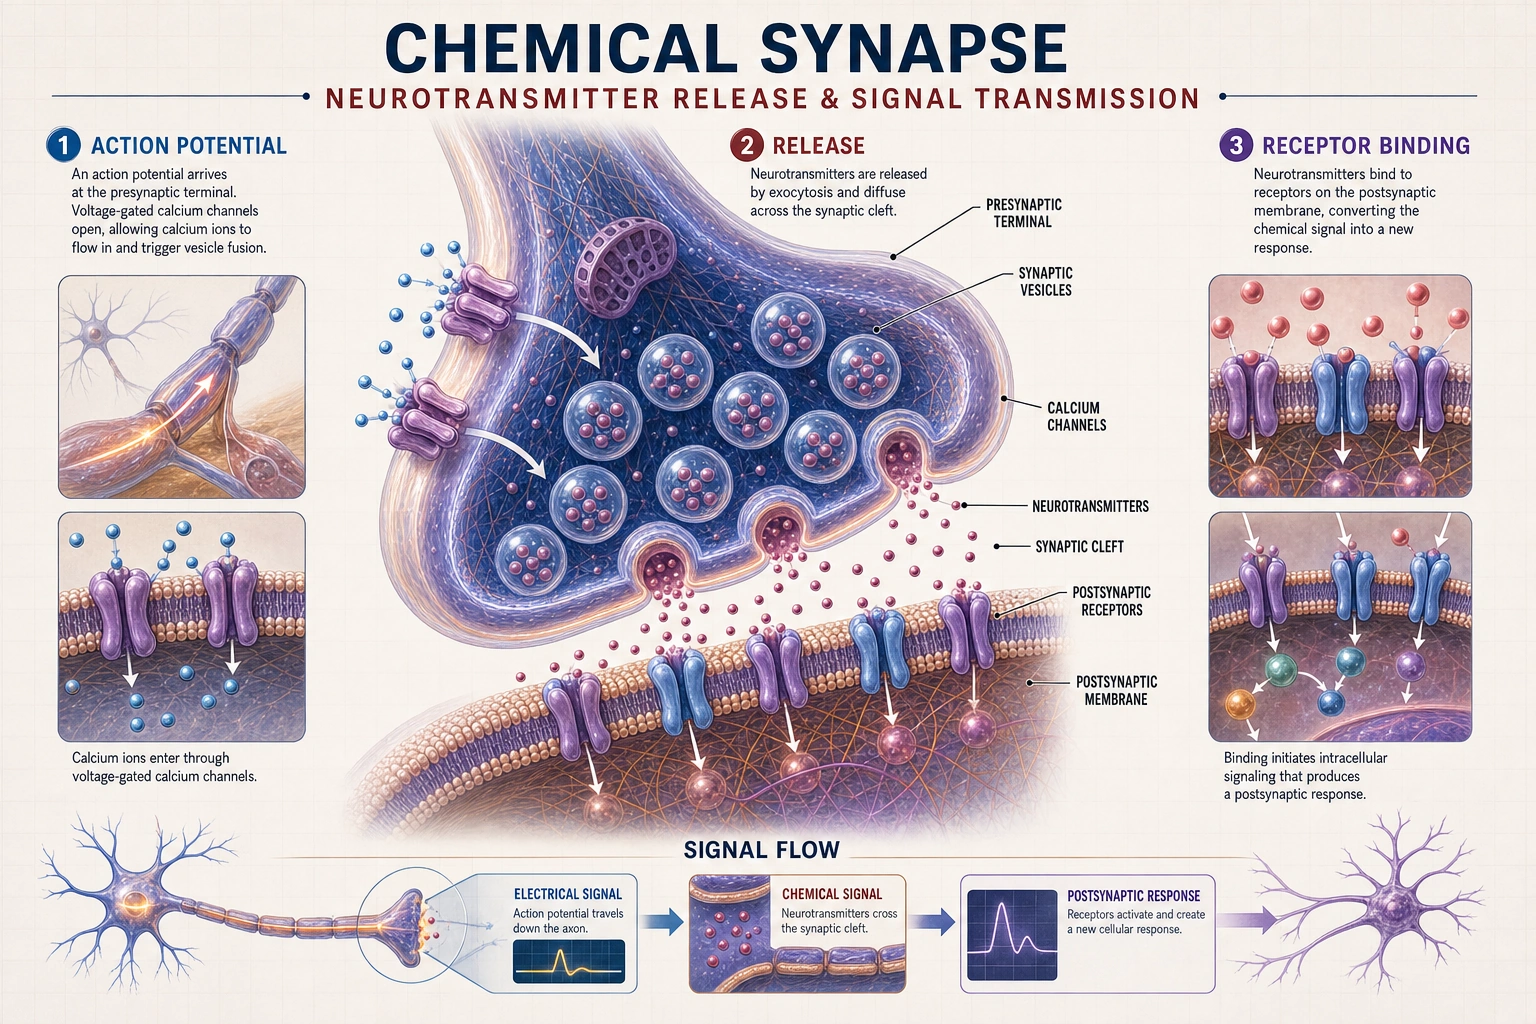
A strong scientific visual begins with the presentation question and audience, not a collection of disconnected illustrations or data blocks.
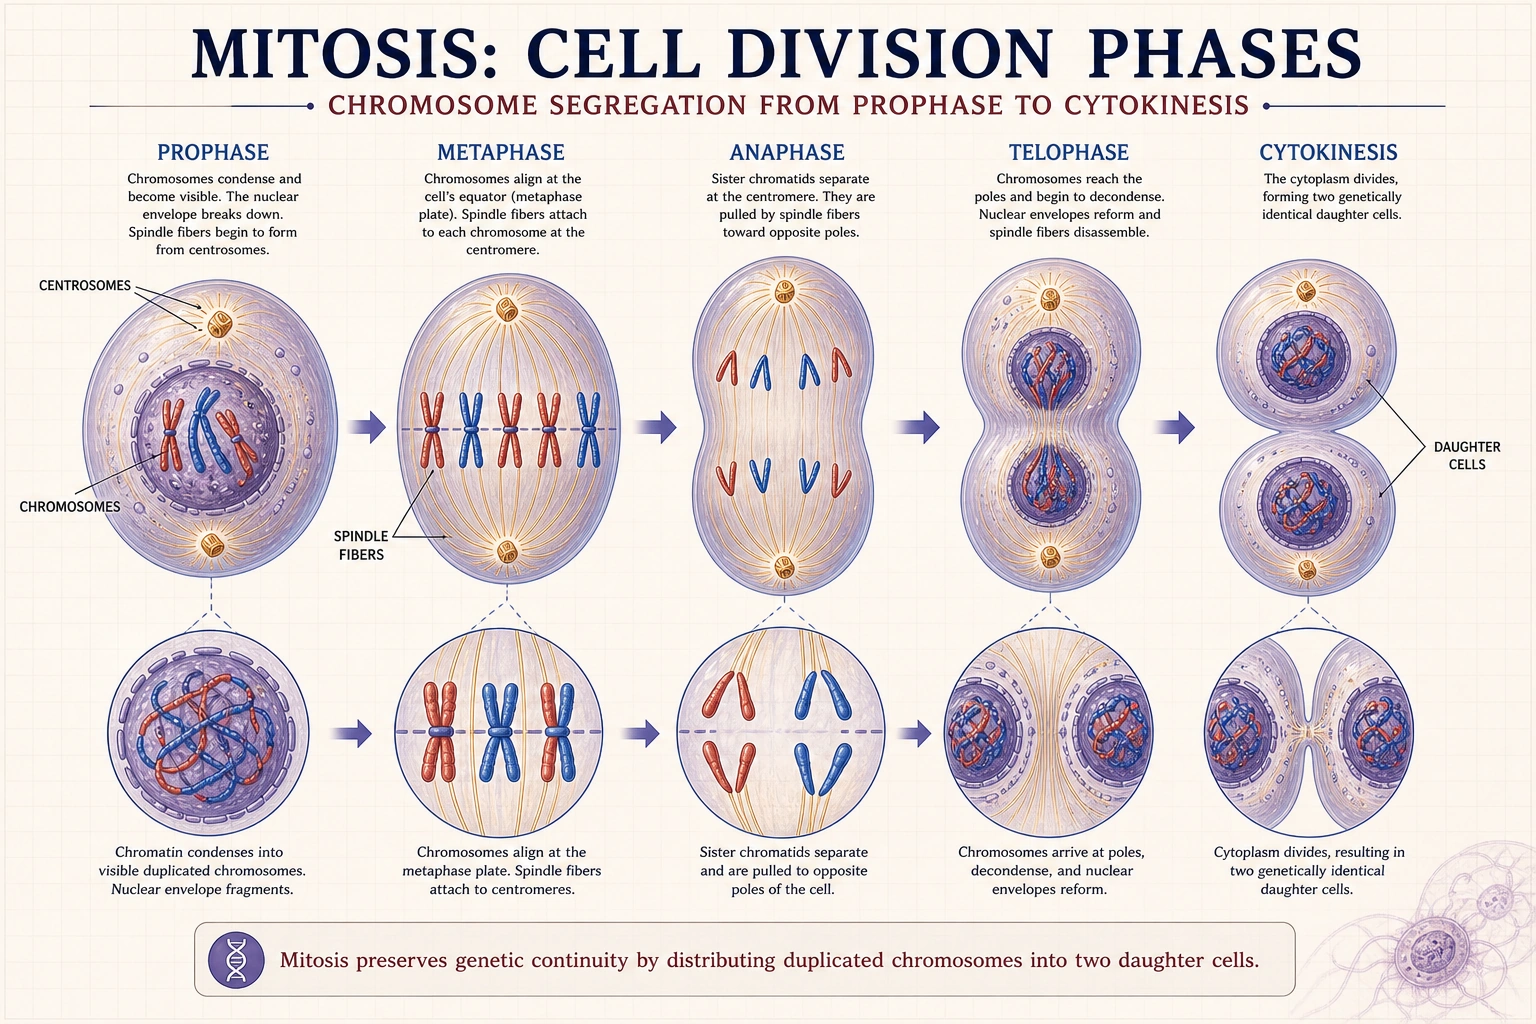
Use visual structure to prevent a conceptual mechanism or illustrative readout from being mistaken for experimental data or a published conclusion.
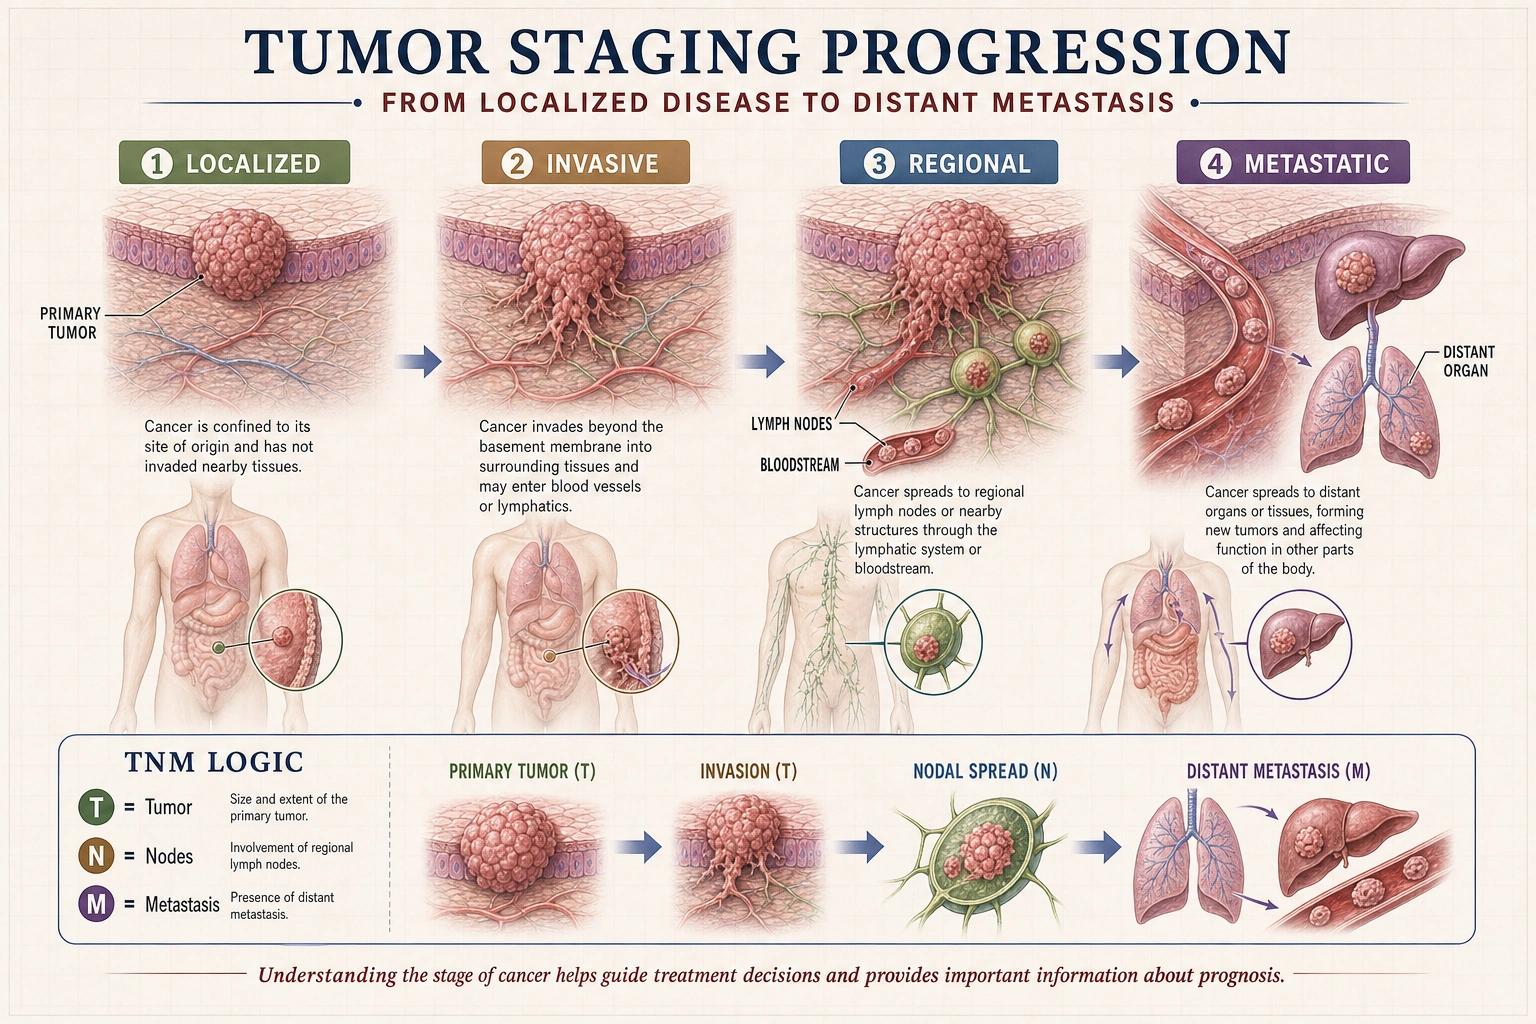
Scientific figures need a final pass for data integrity, readability, permissions, and the presentation or publication requirements that apply.
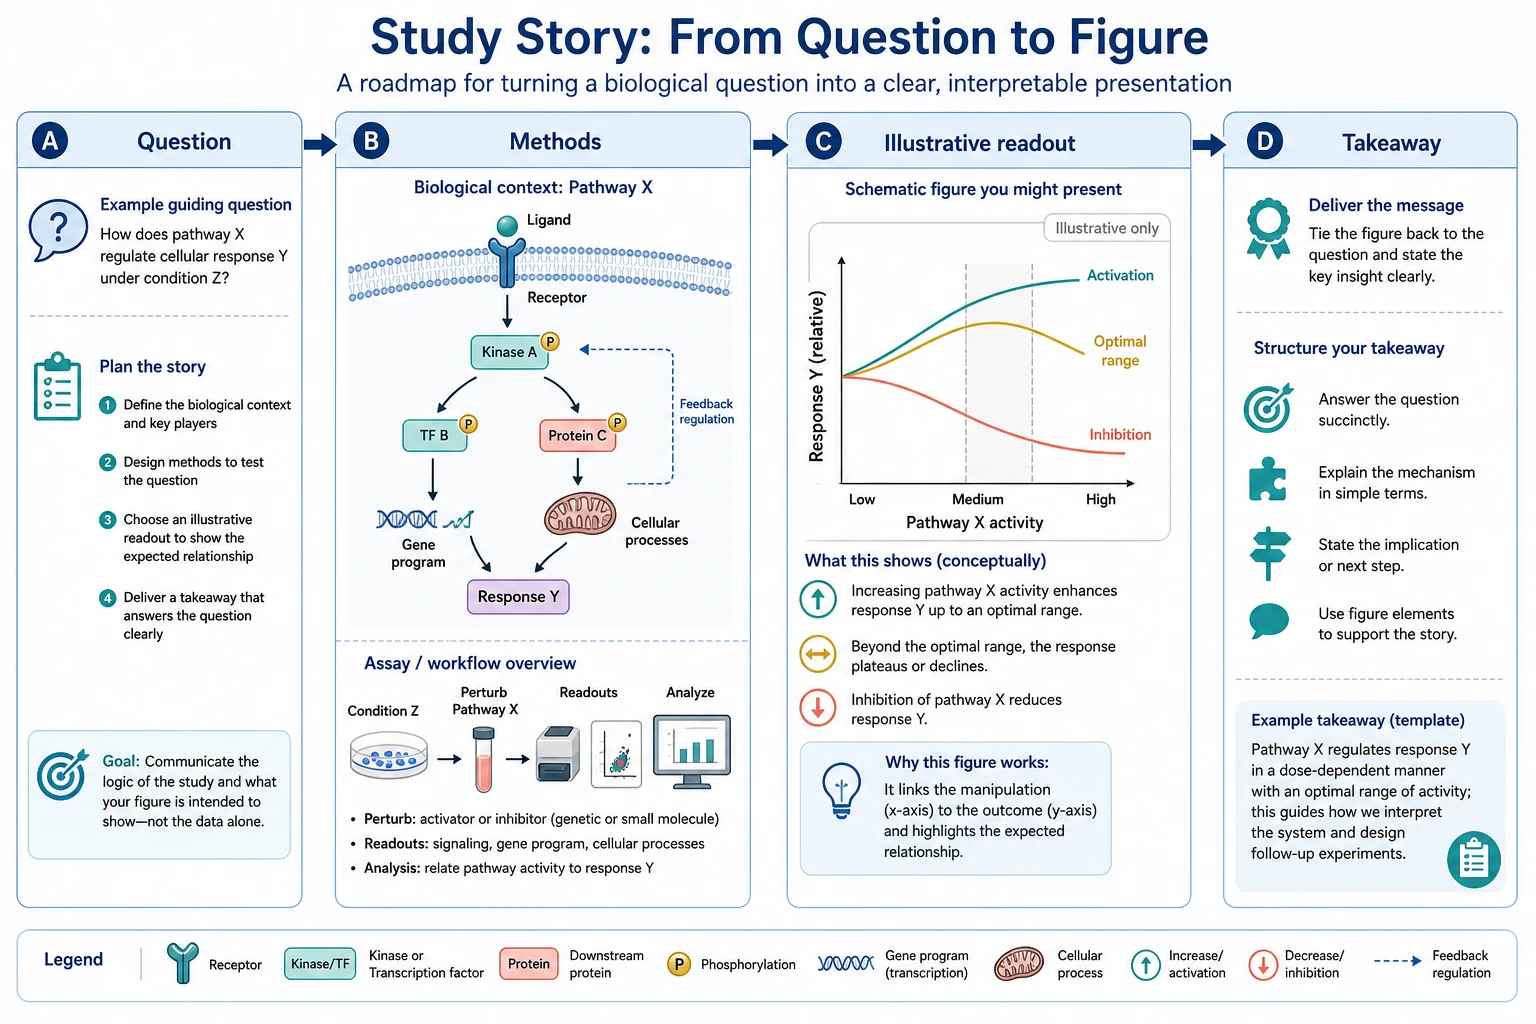
Choose a focused generator when the visual needs a more specific starting point.
Open an example to inspect a possible hierarchy, then adapt the prompt only from your approved evidence, figure plan, and review process.
Use a clear sequence to frame the question, experimental context, analysis, and qualified result.
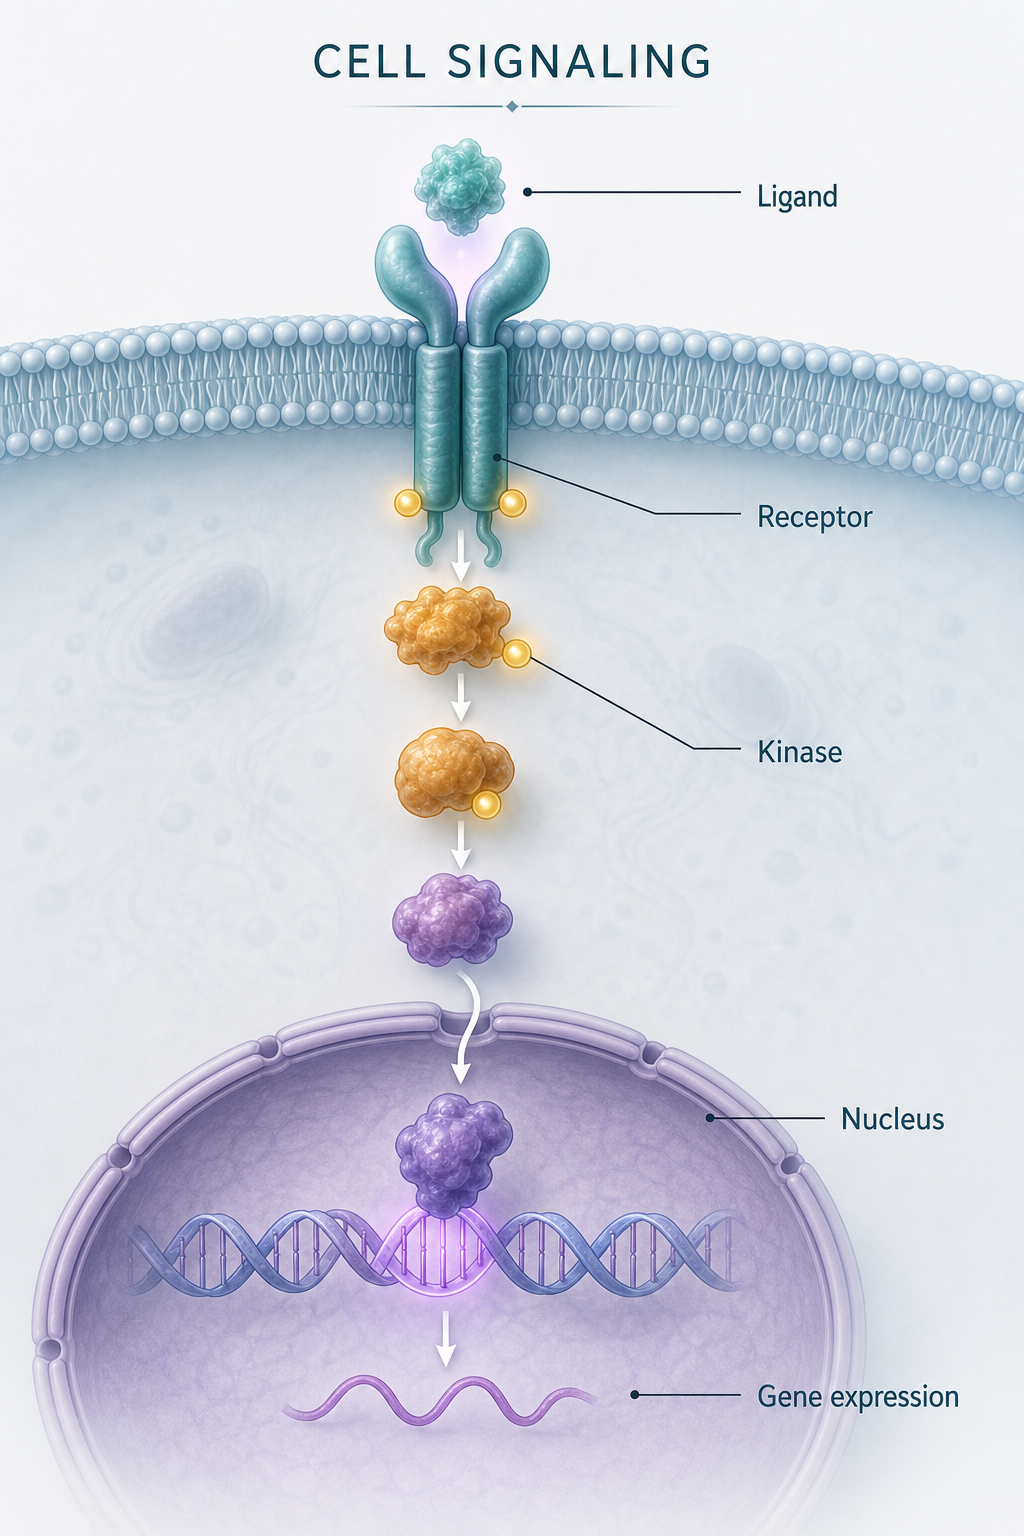
Make conceptual pathways easy to distinguish from source-backed evidence and measured results.
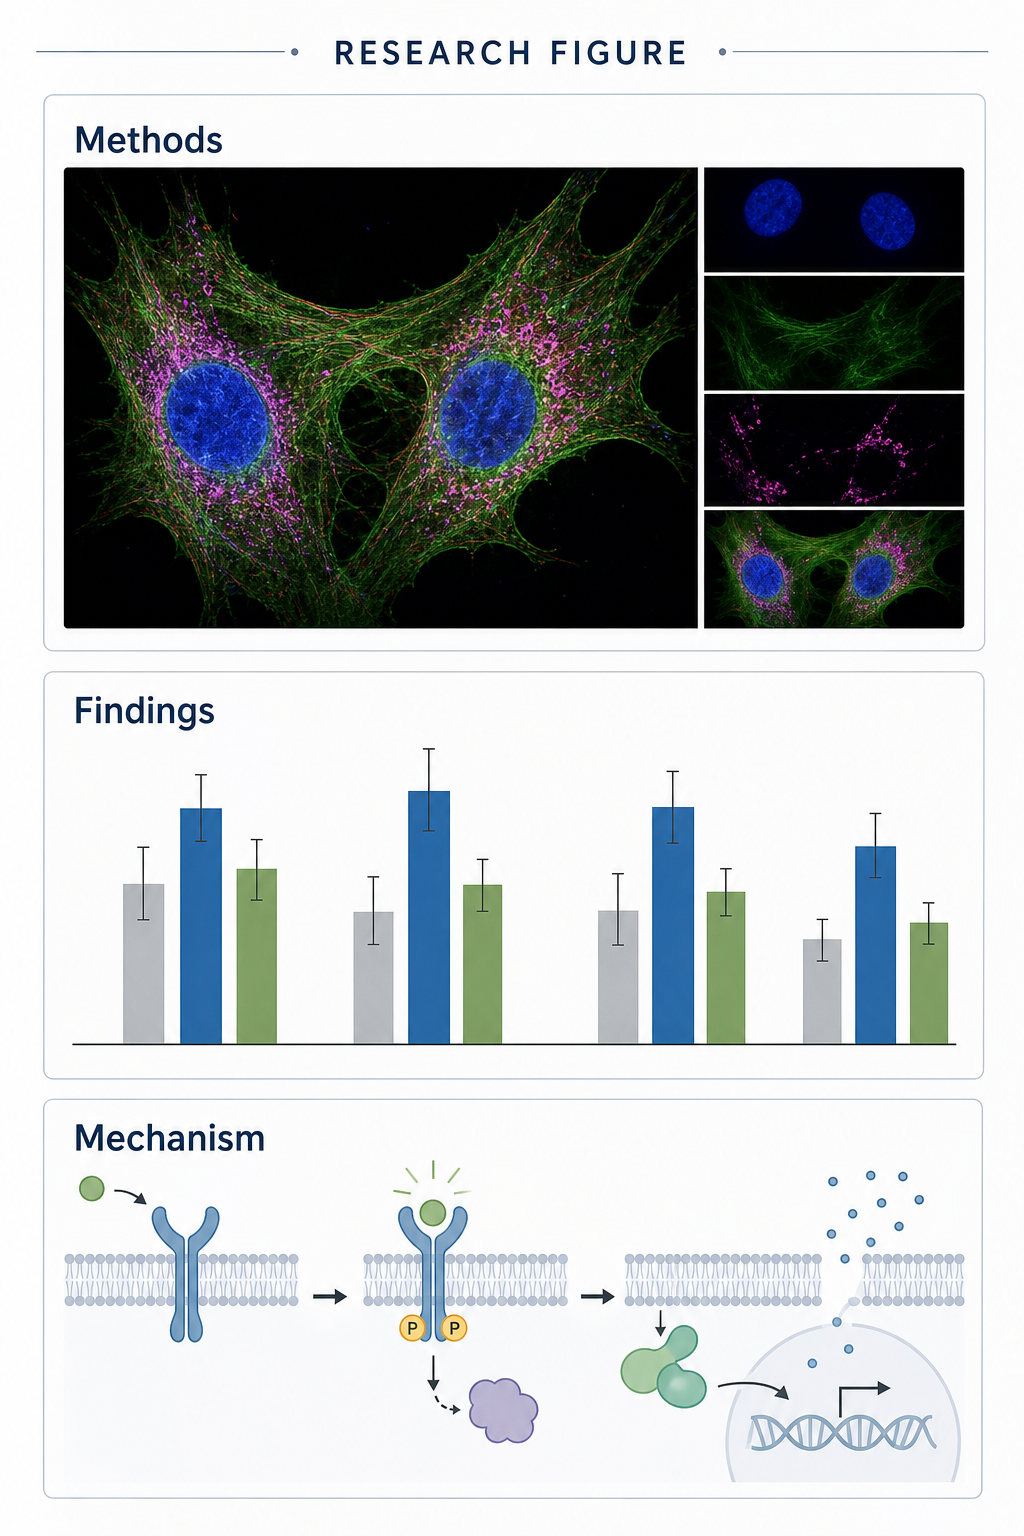
Bring methods, findings, and interpretation into one readable visual structure.
Experiences from educators, clinicians, and researchers using Medical Illustration in their own review workflows.
I needed a hepatic portal system diagram for a resident lecture. The generator gave me a labeled first draft that our teaching team could review and refine before class.

Sarah Mitchell
General Surgeon
My students struggle with spatial relationships in the brachial plexus. Using this anatomy diagram generator, I can create multiple-angle anatomy diagrams during class for comparison. This kind of real-time visual teaching was impossible before AI medical illustration tools.

Marco Reyes
Anatomy Professor
Explaining congenital heart defects to parents is hard. I use this medical illustration tool to create patient education diagrams showing their child's specific condition with clear before-and-after views of the surgical repair. The free credits let me test it before committing.

Amara Patel
Pediatric Cardiologist
Anatomy exams require identifying structures from every angle. I use this AI medical diagram generator to create labeled anatomy diagrams for study — the brachial plexus, cardiac valves, cranial nerves. It's way faster than redrawing from Netter's atlas.

Alex Nguyen
4th Year Medical Student
My dissertation requires many scientific figures, so I use this AI medical illustration tool to draft neural pathway layouts before manual polishing. It gives me a faster starting point for discussions with my committee.

Priya Sharma
PhD Candidate · Neuroscience
I use this medical diagram generator to draft catheter-positioning diagrams for IR teaching. The medical illustrations give residents a clearer starting point before we review anatomy and procedural details together.

Marcus Davis
Interventional Radiologist
I needed a hepatic portal system diagram for a resident lecture. The generator gave me a labeled first draft that our teaching team could review and refine before class.
Sarah Mitchell
General Surgeon
My students struggle with spatial relationships in the brachial plexus. Using this anatomy diagram generator, I can create multiple-angle anatomy diagrams during class for comparison. This kind of real-time visual teaching was impossible before AI medical illustration tools.
Marco Reyes
Anatomy Professor
Explaining congenital heart defects to parents is hard. I use this medical illustration tool to create patient education diagrams showing their child's specific condition with clear before-and-after views of the surgical repair. The free credits let me test it before committing.
Amara Patel
Pediatric Cardiologist
Anatomy exams require identifying structures from every angle. I use this AI medical diagram generator to create labeled anatomy diagrams for study — the brachial plexus, cardiac valves, cranial nerves. It's way faster than redrawing from Netter's atlas.
Alex Nguyen
4th Year Medical Student
My dissertation requires many scientific figures, so I use this AI medical illustration tool to draft neural pathway layouts before manual polishing. It gives me a faster starting point for discussions with my committee.
Priya Sharma
PhD Candidate · Neuroscience
I use this medical diagram generator to draft catheter-positioning diagrams for IR teaching. The medical illustrations give residents a clearer starting point before we review anatomy and procedural details together.
Marcus Davis
Interventional Radiologist
Patients understand their biopsy results better when I show them a skin layer diagram with the lesion location marked. I generate these dermatology medical illustrations during consultations — takes about 30 seconds.

Mei-Ling Chen
Dermatologist
We review many figure submissions. A structured AI draft can help authors organize labels and panels before editorial review, but every claim and visual relationship still needs checking.

Thomas Eriksen
Medical Journal Editor
I create procedural illustrations for informed consent discussions. Showing patients exactly what a laparoscopic myomectomy involves helps them feel more prepared. It's like having a medical illustrator on call 24/7.

Fatima Al-Rashid
OB/GYN Specialist
For our EM residency curriculum, I draft visual guides for central lines and chest tubes, then verify each landmark and sequence with faculty before teaching.

Nathan Brooks
Emergency Medicine Physician
Microscopy images are hard for first-year students to interpret. I generate annotated cross-section diagrams alongside real slides so students can map what they see under the microscope to labeled structures.

Clara Reinholt
Histology Professor
Pre-operative planning with patients is much smoother now. I generate reconstructive flap diagrams tailored to their anatomy. The patient education illustrations help set realistic expectations before surgery.

Robert Lindqvist
Plastic & Reconstructive Surgeon
Patients understand their biopsy results better when I show them a skin layer diagram with the lesion location marked. I generate these dermatology medical illustrations during consultations — takes about 30 seconds.
Mei-Ling Chen
Dermatologist
We review many figure submissions. A structured AI draft can help authors organize labels and panels before editorial review, but every claim and visual relationship still needs checking.
Thomas Eriksen
Medical Journal Editor
I create procedural illustrations for informed consent discussions. Showing patients exactly what a laparoscopic myomectomy involves helps them feel more prepared. It's like having a medical illustrator on call 24/7.
Fatima Al-Rashid
OB/GYN Specialist
For our EM residency curriculum, I draft visual guides for central lines and chest tubes, then verify each landmark and sequence with faculty before teaching.
Nathan Brooks
Emergency Medicine Physician
Microscopy images are hard for first-year students to interpret. I generate annotated cross-section diagrams alongside real slides so students can map what they see under the microscope to labeled structures.
Clara Reinholt
Histology Professor
Pre-operative planning with patients is much smoother now. I generate reconstructive flap diagrams tailored to their anatomy. The patient education illustrations help set realistic expectations before surgery.
Robert Lindqvist
Plastic & Reconstructive Surgeon
I create respiratory system diagrams for my COPD and asthma patient handouts. The illustrations are clear enough that patients actually take the materials home and reference them between appointments.

Hannah Müller
Pulmonologist
I use the workspace to explore anatomy-diagram directions for educational videos, then revise the labels, composition, and source notes before publishing.

Jordan Kim
Medical Education Content Creator
For endoscopy reports, I attach AI-generated diagrams showing polyp location relative to anatomical landmarks. Referring physicians appreciate the visual clarity over text descriptions alone. Much better than a BioRender template.

Sofia Torres
Gastroenterologist
I draft simplified retinal diagrams for counseling, then compare them with the approved clinical material and explain the actual OCT findings separately.

David Kwon
Ophthalmologist
Athletes want to understand their injuries. Showing a labeled orthopedic diagram of their specific ACL tear pattern or meniscus damage makes the rehab timeline conversation much more productive.

Lisa Chen
Sports Medicine Nurse
For tumor board presentations, I generate clean pathology diagrams showing staging and margins. The visual standardization helps the multidisciplinary team discuss treatment options more efficiently.

Carlos Rivera
Pathology Assistant
I create respiratory system diagrams for my COPD and asthma patient handouts. The illustrations are clear enough that patients actually take the materials home and reference them between appointments.
Hannah Müller
Pulmonologist
I use the workspace to explore anatomy-diagram directions for educational videos, then revise the labels, composition, and source notes before publishing.
Jordan Kim
Medical Education Content Creator
For endoscopy reports, I attach AI-generated diagrams showing polyp location relative to anatomical landmarks. Referring physicians appreciate the visual clarity over text descriptions alone. Much better than a BioRender template.
Sofia Torres
Gastroenterologist
I draft simplified retinal diagrams for counseling, then compare them with the approved clinical material and explain the actual OCT findings separately.
David Kwon
Ophthalmologist
Athletes want to understand their injuries. Showing a labeled orthopedic diagram of their specific ACL tear pattern or meniscus damage makes the rehab timeline conversation much more productive.
Lisa Chen
Sports Medicine Nurse
For tumor board presentations, I generate clean pathology diagrams showing staging and margins. The visual standardization helps the multidisciplinary team discuss treatment options more efficiently.
Carlos Rivera
Pathology Assistant
Use the layout to align collaborators, then finalize it with the real data, source citations, and review process required for your setting.